menu

Plate Tectonics

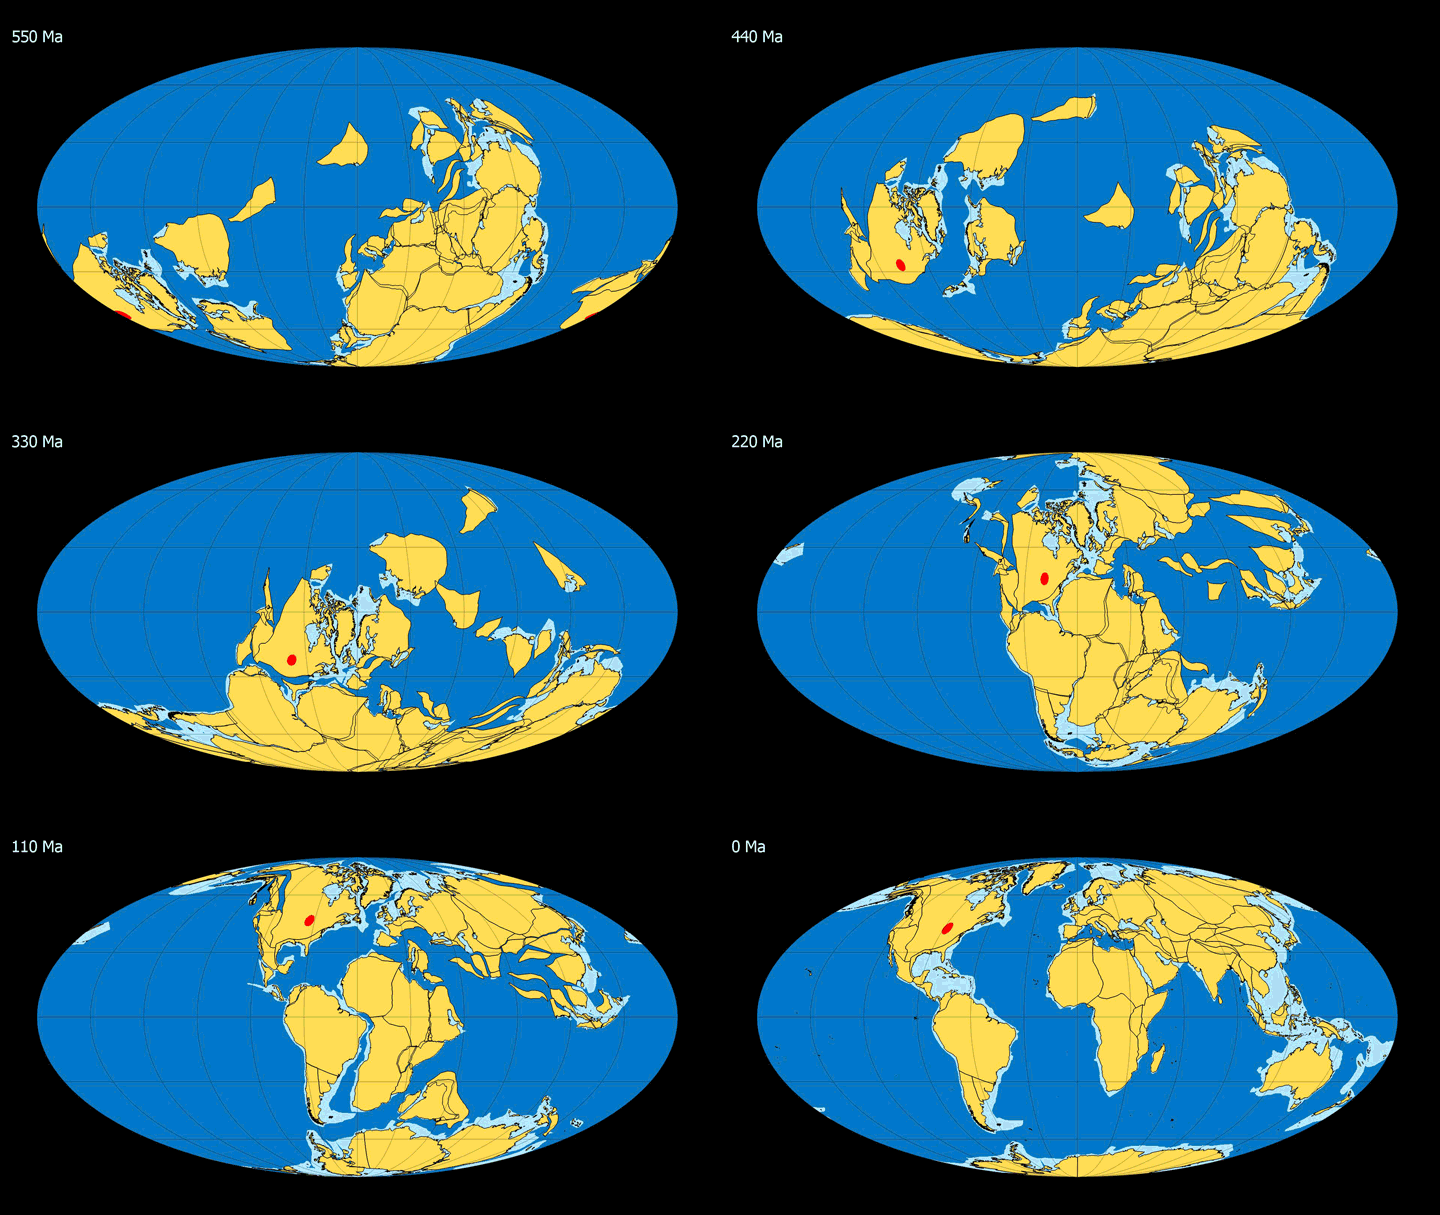
NOTE: The YELLOW AREAS on the maps represent land areas and shallow seas surrounding the continents. BLUE AREAS are deep oceans. The RED DOT shows the location of Chicago.

Plate tectonics is the theory that the Earth’s crust is composed of rigid plates that float on the Earth’s pliable mantle. There are two types of plates: thick, light continental plates composed  mostly of granite (aluminum silicates) and thin dense oceanic plates composed mostly of basalt (magnesium and iron silicates). Convection currents caused by the heat of radioactive elements decaying in the Earth’s mantle and core cause the plates to move.

When two plates collide there are four possible boundaries:
1) At a continental-continental plate boundary large mountains are uplifted, like the Himalayas.
2) At a continental-oceanic plate boundary the heavier oceanic plate slides underneath the lighter continental plate, melts, and its lighter material floats back up forming volcano chains, like the Cascades and Andes.
3) At an oceanic-oceanic plate boundary one plate slides below another and a volcanic island arc forms, like Japan.
4) Sometimes plates just slide by each other as in a transform boundary. This type of boundary causes many earthquakes; the San Andreas Fault is an example of a transform boundary.

Understanding plate tectonics is important for studying Silurian reefs because it explains how plates and continents move over the surface of the planet. As the landmasses move they can go from tropical to temperate to polar regions and the fossils preserved in the rocks record these changes, allowing us to examine and explore ancient environments and how they are related to the past position of ancient landmasses.

Videos

This is my latest video that shows plate motions, changing sea level, mountain building, and ice ages. To find out how the maps were made go to: https://www.earthbyte.org/paleomap-pa.... Though similar to my previous animations, this one is very different in three ways: 1) a more realistic rendition of sea level change, 2) a more accurate illustration of ice cap growth and contraction, and 3) the ability to easily add geographic "details" that travel with the continents (e.g., red dot for Chicago). Let me know what kinds of geographic details that you would like to see added to the map to make the animation more interesting and informative. In the next version I will be adding color dots for the following cities: New York, Anchorage, Rio de Janeiro, Cairo, Capetown, London, Paris, Moscow, Mumbai, Sydney, Kuala Lumpur, Beijing, Shanghai, Tehran, and a few others. This animation was made using Adobe After Effects and "Gplates" , see https://www.gplates.org/ for more info. Please cite this animation as: "Scotese, C.R., 2019. Plate Tectonics, Paleogeography, and Ice Ages, YouTube video: https://youtu.be/UevnAq1MTVA." - Chris Scotese License Creative Commons Attribution license (reuse allowed)