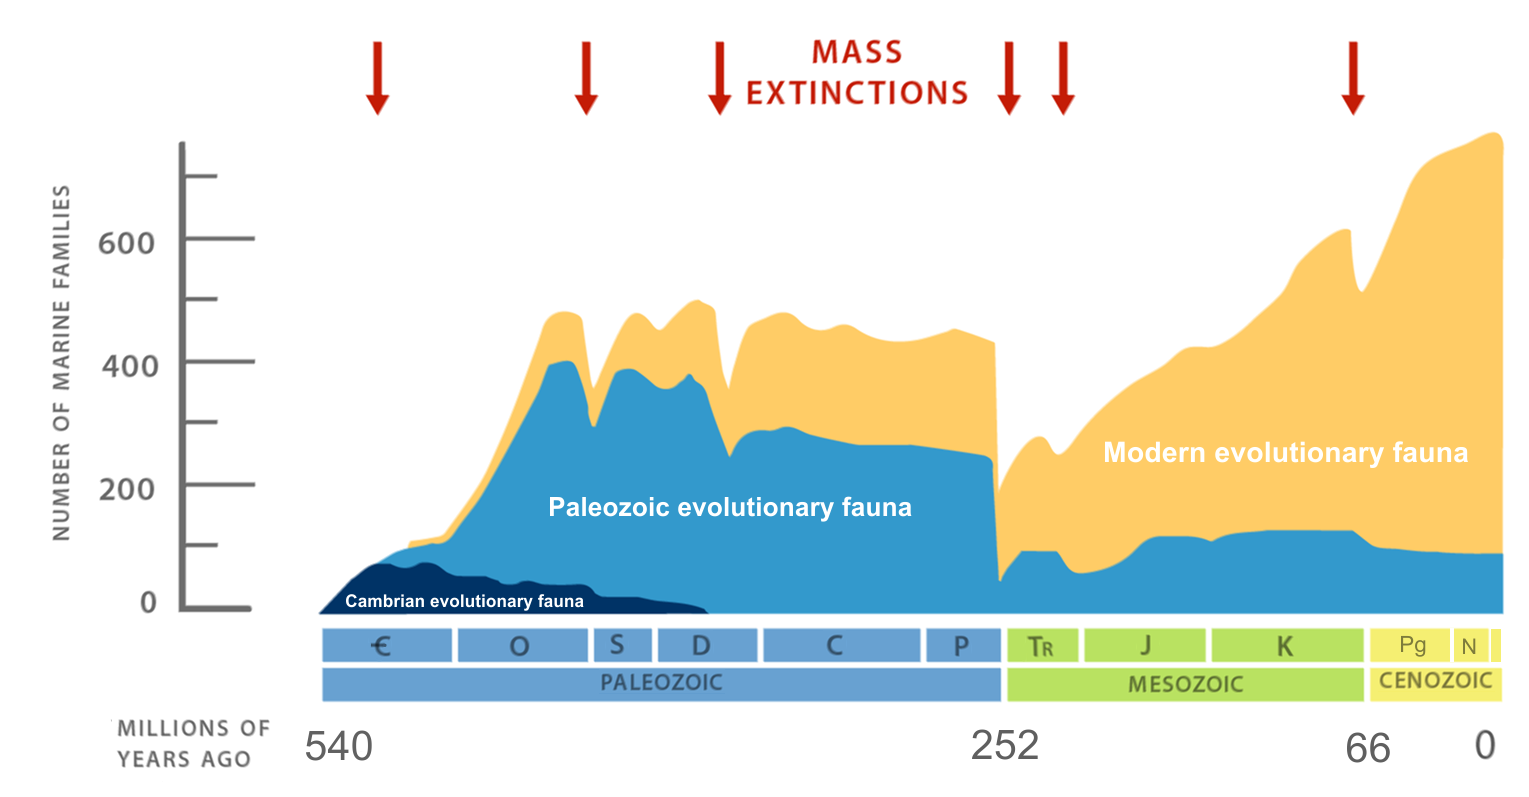
There are many different ways to measure biodiversity. In the above example, the biodiversity curve measures the changes in world-wide diversity over time. It was compiled by counting the number of marine families present in each time interval. This curve was created by Jack Sepkoski using thousands of data sets from around the world and it represents the work of hundreds of paleontologists.
The geologic time scale is at the bottom of the chart with the oldest time (540 million years ago) on the left and the youngest (the present) on the right. The number of marine families ranges from 0 bottom of chart to over 700 at the top of the curve.
The curve is composed of three different colors that represent Sepkoski's three evolutionary faunas. The dark blue is the Cambrian evolutionary fauna which includes trilobites and inarticulate brachiopods. The medium blue is the Paleozoic evolutionary fauna that includes brachiopods, crinoids, bryozoans, tabulate and rugose corals and nautiloid cephalopods. The yellow is the Modern evolutionary fauna that includes scleractinian corals, molluscs, and foraminifera.
Examining the curve, you can see that the highest diversity throughout geologic time occurs today. The lowest diversity was at the start of the Cambrian Period, after which you can see a rapid increase in diversity, especially during the Ordovician. During the rest of the Paleozoic, diversity seems to have leveled out at about 500 marine families, creating a fairly level plateau.
The six red arrows show mass extinction events. Notice how diversity dips at each of these events and then rapidly increases afterwards. The Permian Mass Extinction event is the biggest mass extinction, and occurred at the end of Permian Period. It marks the end of the Paleozoic Era and the beginning of the Mesozoic Era. The Silurian Period, marked by a ‘S’ in the timescale, occurred just after the end-Ordovician extinction event. There is a rapid diversification during the first part of the Silurian Period, and the curve reaches a peak during the middle part of the Silurian Period which is when Silurian reefs were thriving. There is a small drop in diversity at the end of the Silurian, marking the start of the Devonian Period. This drop in diversity is not big enough to be labelled a mass extinction event, but it does mark the end of reef formation until the Middle Devonian about 40 million years later.
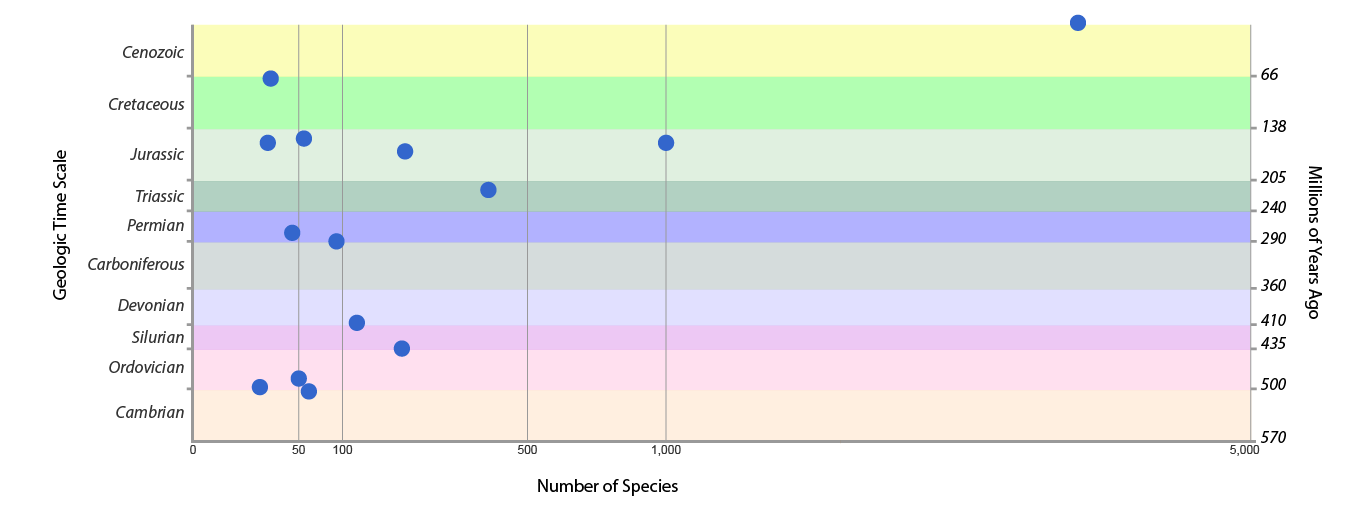
Comparing reefs through time. The diagram below, which does not include sample size, shows a dramatic increase in species diversity of reefs from Ordovician to modern times. Note log scale on axis for number of species. Nearly 200 species have been recorded from Silurian reefs while Triassic reefs have nearly double the number of recorded species. Jurassic reefs have over 1000 species and modern reefs over 4,000 species which is 20 times the number recorded from Silurian reefs. How much of this difference is due to bias in the fossil record is debated, but modern reefs are much more diverse than Silurian reefs.